Maybe it’s just me, but I have always been told that most things happen out of fear and greed, and my experience in the electric utility industry is that more often than not, fear is the basis for most utility actions … perhaps rightfully so given how bad public opinion can hurt when you fail to live up to expectations.
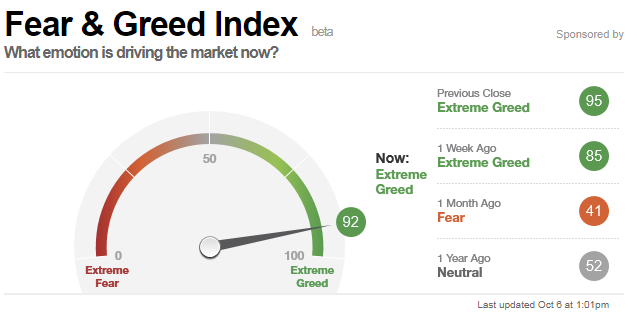
So, it was a bit of a surprise to me that Wall Street monitors these in the markets as an index. Read it for yourself. Then, consider where this index is right now … up against the greed limit … it can’t get much higher. I wonder if we could track the mood in the utility industry the same way? I think we can certainly all agree it is not pegged against this limit by any stretch of the imagination.
What is the Fear & Greed Index?
Investors are driven by two emotions: fear and greed. Too much fear can sink stocks well below where they should be. When investors get greedy, they can bid up stock prices way too far.
So what emotion is driving the market now? CNN Money’s Fear & Greed index makes it clear.
We look at 7 indicators:
- Stock Price Momentum: The S&P 500 (SPX) versus its 125-day moving average
- Stock Price Strength: The number of stocks hitting 52-week highs and lows on the New York Stock Exchange
- Stock Price Breadth: The volume of shares trading in stocks on the rise versus those declining.
- Put and Call Options: The put/call ratio, which compares the trading volume of bullish call options relative to the trading volume of bearish put options
- Junk Bond Demand: The spread between yields on investment grade bonds and junk bonds
- Market Volatility: The VIX (VIX), which measures volatility
- Safe Haven Demand: The difference in returns for stocks versus Treasuries
For each indicator, we look at how far they’ve veered from their average relative to how far they normally veer. We look at each on a scale from 0 – 100. The higher the reading, the greedier investors are being, and 50 is neutral.
Then we put all the indicators together – equally weighted – for a final index reading.
When the S&P 500 (SPX) plummeted to a three-year low on Sept. 17, 2008 – the height of the financial crisis — the Fear and Greed index sank to 12. The index gained some ground to 28 before stocks finally bottomed out on March 9, 2009 and the latest bull market began.
Most recently, in the first quarter of 2012, stocks staged their best run in decades, and the index showed pure greed.
